The Resistance Playbook: Tactical Solutions for Data Literacy's Toughest Challenges
The Bottom Line Up Front: Every data literacy transformation encounters predictable resistance patterns, but these obstacles aren't insurmountable walls—they're puzzles with specific solutions. The organizations that succeed don't avoid resistance; they anticipate it, understand its sources, and deploy targeted interventions that transform opposition into opportunity.
The Anatomy of Resistance: Why Good People Fight Good Ideas
After examining dozens of data literacy transformations, a paradox emerges: the people who resist data literacy initiatives often aren't luddites or contrarians. They're frequently high performers who have succeeded without sophisticated analytical thinking. Understanding why competent, well-intentioned people resist data literacy is the first step toward helping them embrace it.
Resistance to data literacy isn't really about data at all. It's about identity, power, vulnerability, and deeply held beliefs about how knowledge works. When we ask someone to become more data literate, we're not just asking them to learn new skills—we're asking them to fundamentally change how they make sense of the world.
Consider the senior executive who built their career on relationship intuition and political acumen. To them, data literacy can feel like an admission that their way of knowing is inferior. Or the frontline manager who knows their operation intimately through years of experience. Statistical analysis might seem to diminish the value of their hard-earned wisdom.
These aren't irrational responses. They're protective mechanisms defending something precious: professional identity and self-worth. Any approach to overcoming resistance must begin with empathy for what people fear they might lose.
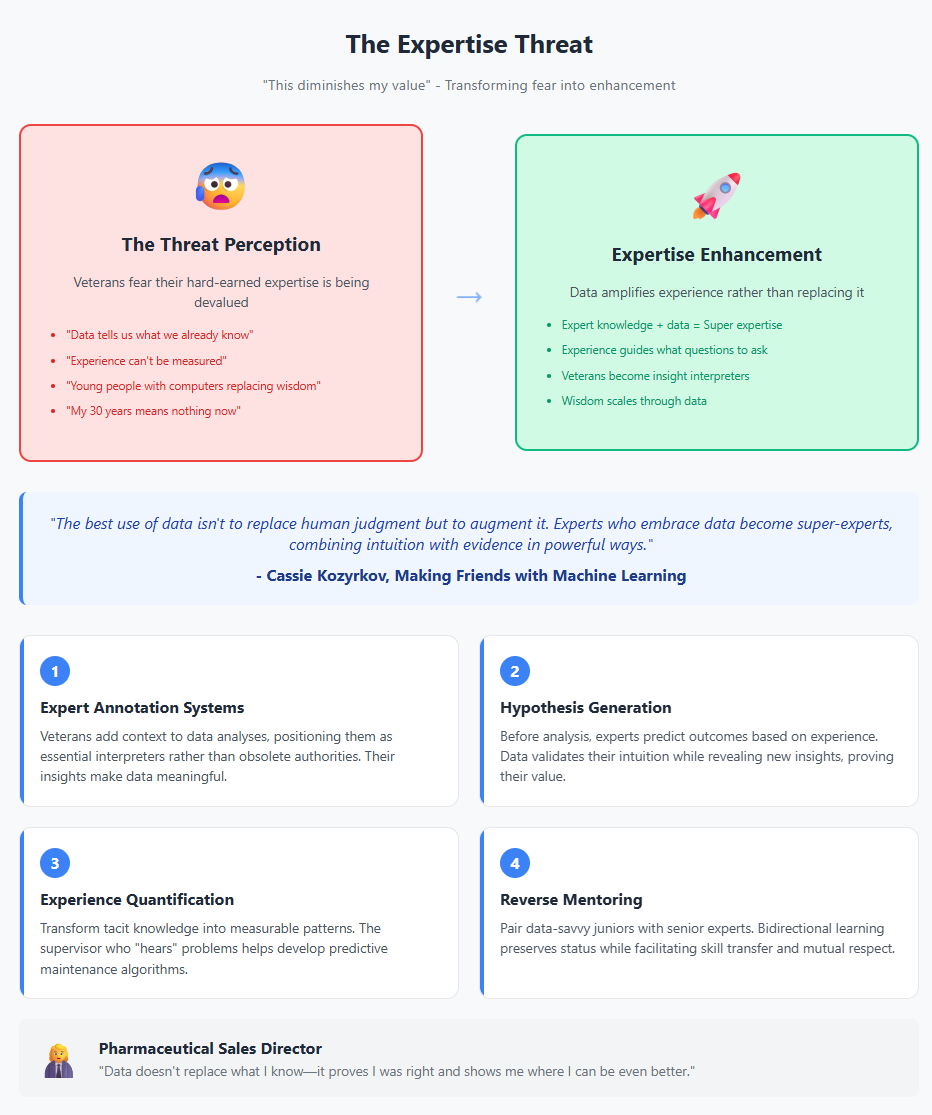
Obstacle 1: The Expertise Threat - "This Diminishes My Value"
The Pattern
Veterans in any field develop what cognitive scientists call "expert intuition"—the ability to recognize patterns and make decisions quickly based on accumulated experience. When organizations introduce data literacy initiatives, these experts often perceive an existential threat: if decisions can be made through data analysis, what value does their expertise provide?
This fear manifests in various ways:
- Dismissing data as "telling us what we already know"
- Emphasizing unmeasurable factors that "only experience can judge"
- Creating false dichotomies between "book learning" and "real world knowledge"
- Subtly sabotaging data initiatives by providing poor quality inputs
The Deep Structure
The expertise threat touches on fundamental human needs for competence and relevance. As Daniel Pink notes in Drive, mastery is one of three core human motivators. When people feel their mastery is being devalued, they experience what researchers call "competence threat"—a psychological state that triggers defensive responses.
This defensiveness is compounded by legitimate concerns about ageism and technological displacement. In many organizations, data literacy initiatives coincide with generational transitions, reinforcing fears that experience is being systematically devalued in favor of technical skills more common among younger workers.
The Solution: Expertise Enhancement Framing
The most effective approach reframes data literacy not as a replacement for expertise but as an amplifier of it. This requires what we might call "expertise enhancement design"—deliberately structuring data literacy initiatives to highlight how analytical thinking makes expert knowledge more powerful, not less relevant.
Tactical Implementation:
1. Expert Annotation Systems: Create processes where experienced practitioners add context to data analyses. For instance, a sales veteran might annotate CRM analytics with insights about relationship dynamics that numbers can't capture. This positions experts as essential interpreters rather than obsolete authorities.
2. Hypothesis Generation Workshops: Before conducting analyses, gather experts to generate hypotheses based on their experience. Then use data to test these hypotheses. This validates experiential knowledge while demonstrating how data can extend and refine expert intuition.
As Cassie Kozyrkov writes in Making Friends with Machine Learning, "The best use of data isn't to replace human judgment but to augment it. Experts who embrace data become super-experts, combining intuition with evidence in powerful ways."
3. Experience Quantification Projects: Work with experts to identify patterns they recognize intuitively, then collaborate to find ways to detect these patterns in data. A maintenance supervisor who can "hear" when a machine needs service might help develop acoustic monitoring algorithms. This transforms tacit knowledge into scalable insights.
4. Storytelling Integration: Train experts to use data as evidence within their existing storytelling practices. Rather than replacing war stories with spreadsheets, show how data can make their narratives more compelling and credible.
5. Reverse Mentoring Programs: Pair data-savvy junior employees with senior experts, but make the learning explicitly bidirectional. Juniors teach analytical techniques while seniors teach domain interpretation. This preserves status while facilitating skill transfer.
Case Example: The Sales Director's Transformation
A pharmaceutical sales director with 30 years of experience initially fought every data initiative, insisting that "relationships can't be measured." The transformation team invited her to a hypothesis workshop where she predicted which factors most influenced prescription patterns based on her experience.
When analysis confirmed 80% of her hypotheses while revealing surprising insights about the remaining 20%, her perspective shifted. She became the program's strongest advocate, famous for saying, "Data doesn't replace what I know—it proves I was right and shows me where I can be even better."
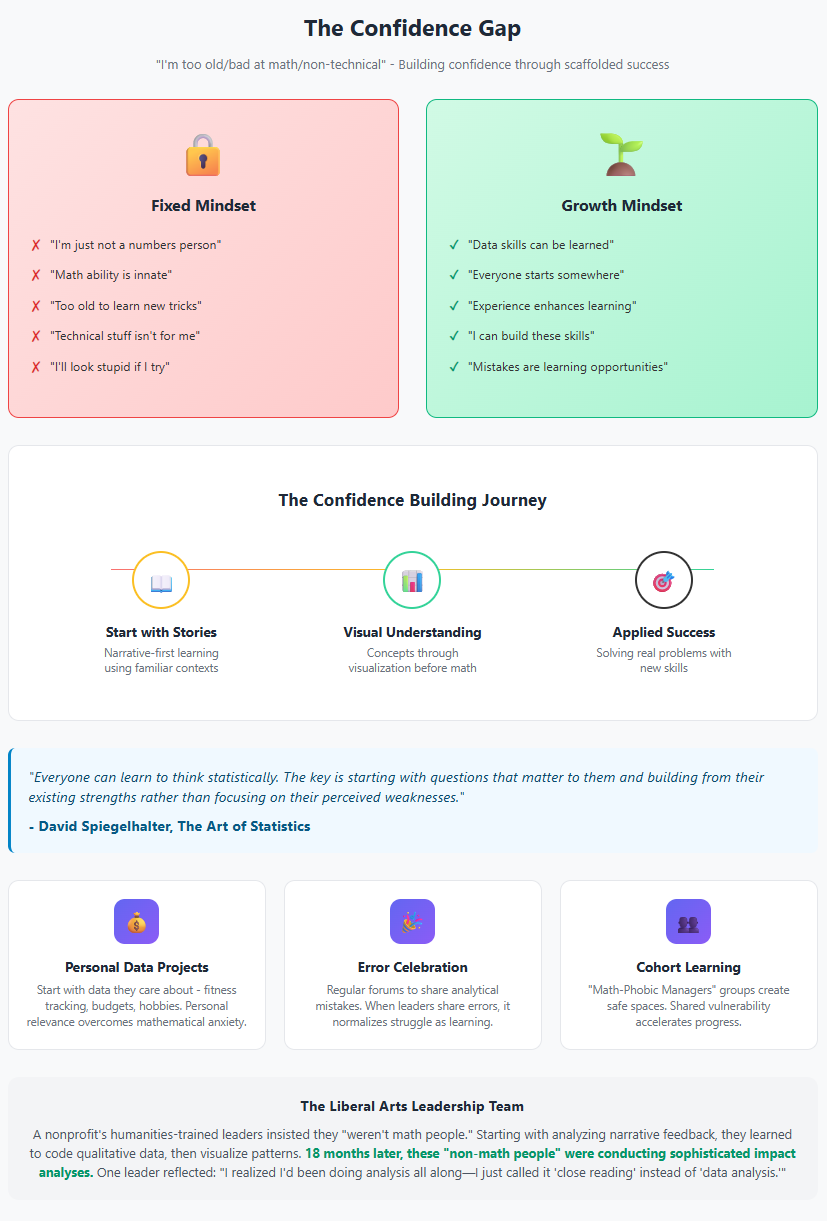
Obstacle 2: The Confidence Gap - "I'm Too Old/Bad at Math/Non-Technical"
The Pattern
Many people carry mathematical trauma from their educational experiences. They've internalized identities as "not math people" or "non-technical," creating self-fulfilling prophecies that block learning before it begins. This confidence gap is often gendered, generational, and cultural, reflecting broader societal messages about who "belongs" in analytical spaces.
Common manifestations include:
- Preemptive self-disqualification ("I'm just not a numbers person")
- Excessive deference to anyone perceived as technical
- Avoiding situations where analytical skills might be tested
- Creating elaborate workarounds to avoid engaging with data
The Deep Structure
The confidence gap reflects what psychologist Carol Dweck calls "fixed mindset"—the belief that analytical ability is an innate trait rather than a learnable skill. This mindset is often reinforced by educational systems that treat mathematical ability as a marker of intelligence rather than a practical skill anyone can develop.
The problem is compounded by what researchers call "stereotype threat"—when people are reminded of negative stereotypes about their group's abilities, their performance actually decreases. Women reminded of gender stereotypes perform worse on math tests. Older workers primed with age-related stereotypes struggle more with technical learning.
The Solution: Confidence Architecture
Overcoming the confidence gap requires what we might call "scaffolded success experiences"—carefully designed learning pathways that build confidence through incremental victories while avoiding triggering stereotype threat or fixed mindset responses.
Tactical Implementation:
1. Narrative-First Learning: Begin with word problems and stories rather than numbers. A budget analyst might start by writing narratives about spending patterns before learning to calculate variances. This leverages verbal strengths while building toward quantitative skills.
2. Personal Data Projects: Let people analyze data they care about personally—fitness tracking, household budgets, fantasy sports statistics. Personal relevance overrides mathematical anxiety and creates emotional investment in analytical success.
3. Error Celebration Rituals: Create regular forums where people share analytical mistakes and what they learned. When leaders share their own mathematical errors, it normalizes struggle and reframes mistakes as learning opportunities rather than competence failures.
As David Spiegelhalter writes in The Art of Statistics, "Everyone can learn to think statistically. The key is starting with questions that matter to them and building from their existing strengths rather than focusing on their perceived weaknesses."
4. Visual-First Analytics: Introduce concepts through visualization before mathematics. A scatter plot showing correlation can be understood intuitively before introducing correlation coefficients. This builds conceptual understanding that makes mathematical formalization feel like clarification rather than complication.
5. Cohort-Based Learning: Create learning cohorts of people with similar backgrounds and confidence levels. A "Math-Phobic Managers" group feels safer than mixed-ability training. Shared vulnerability accelerates learning and creates peer support networks.
Case Example: The Liberal Arts Leadership Team
A nonprofit leadership team—all with humanities backgrounds—insisted they "weren't math people" and resisted data literacy training. The program began with analyzing narrative feedback from beneficiaries, teaching them to code qualitative data for patterns.
Once comfortable finding insights in words, they learned to visualize these patterns. Only after succeeding with visualization did they begin calculating frequencies and correlations. Eighteen months later, these "non-math people" were conducting sophisticated impact analyses, with one leader noting, "I realized I'd been doing analysis all along—I just called it 'close reading' instead of 'data analysis.'"
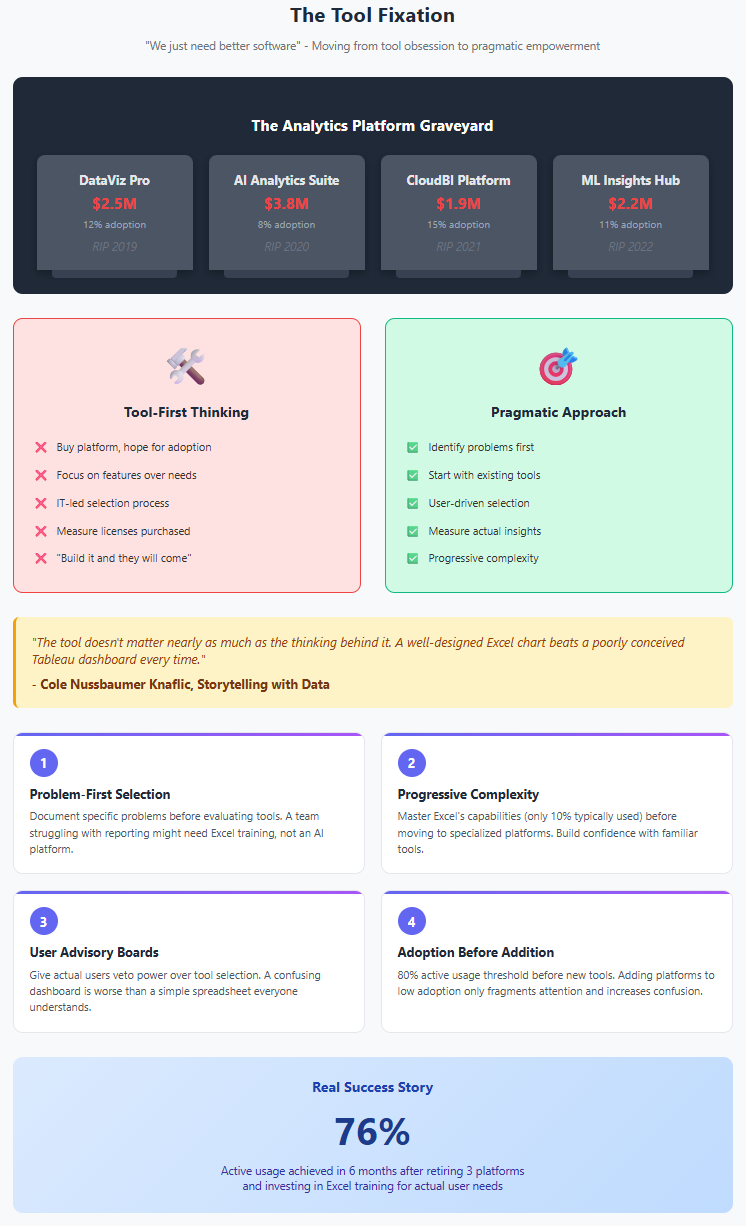
Obstacle 3: The Tool Fixation - "We Just Need Better Software"
The Pattern
Organizations often respond to data literacy challenges by purchasing expensive analytics platforms, believing that better tools will automatically create better analytical thinking. This "tool fixation" displaces focus from capability development to technology deployment, creating expensive distractions from the real work of cultural change.
Symptoms include:
- Endless vendor evaluations and platform migrations
- Believing each new feature will solve adoption challenges
- Measuring success by licenses purchased rather than insights generated
- IT-led initiatives that prioritize technical capabilities over user needs
The Deep Structure
Tool fixation reflects several organizational biases. First, it's easier to buy software than change culture—purchase orders are simpler than transformation programs. Second, tools provide visible evidence of action, satisfying stakeholders who want to see concrete investments. Third, technology vendors are skilled at selling dreams of analytical transformation through product features.
Deeper still, tool fixation represents a form of magical thinking—the belief that complex human and organizational challenges can be solved through technological intervention alone. It's the data literacy equivalent of believing that buying a gym membership will automatically make you fit.
The Solution: Tool Pragmatism
The answer isn't avoiding tools—modern analytics platforms are genuinely powerful. Rather, it's approaching tools with what we might call "pragmatic minimalism"—using the simplest tools that can solve real problems while maintaining focus on capability development over feature accumulation.
Tactical Implementation:
1. Problem-First Tool Selection: Before evaluating any tool, document specific problems people are trying to solve. Map tool capabilities to these problems rather than selecting tools based on abstract feature lists. A team struggling with monthly reporting might need better Excel training, not an AI platform.
2. Progressive Tool Complexity: Start with tools people already know—usually Excel—and maximize their capabilities before introducing new platforms. Most organizations use perhaps 10% of Excel's analytical capabilities. Master the basics before moving to specialized tools.
3. User Advisory Boards: Include actual end users in all tool decisions, with veto power over selections that prioritize IT preferences over user needs. A dashboard that's technically impressive but confusing to business users is worse than a simple spreadsheet everyone understands.
As Cole Nussbaumer Knaflic emphasizes in Storytelling with Data, "The tool doesn't matter nearly as much as the thinking behind it. A well-designed Excel chart beats a poorly conceived Tableau dashboard every time."
4. Tool-Agnostic Training: Teach analytical concepts independently of specific tools, then show implementation across multiple platforms. Understanding correlation conceptually matters more than knowing which button calculates it in SPSS.
5. Adoption Before Addition: Establish minimum adoption thresholds before adding new tools. If fewer than 80% of target users are actively using current tools, adding new ones will only fragment attention and increase confusion.
Case Example: The Analytics Platform Graveyard
A retail company had purchased five different analytics platforms in seven years, each promising to democratize data access. Adoption remained below 15% for each platform. The new approach began with an audit of actual analytical tasks people performed daily.
They discovered 85% of needs could be met with Excel and one visualization tool. They retired three platforms, invested savings in Excel training, and achieved 76% active usage within six months. The CTO reflected, "We were solving the wrong problem. People didn't need better tools—they needed to understand why data mattered to their jobs."
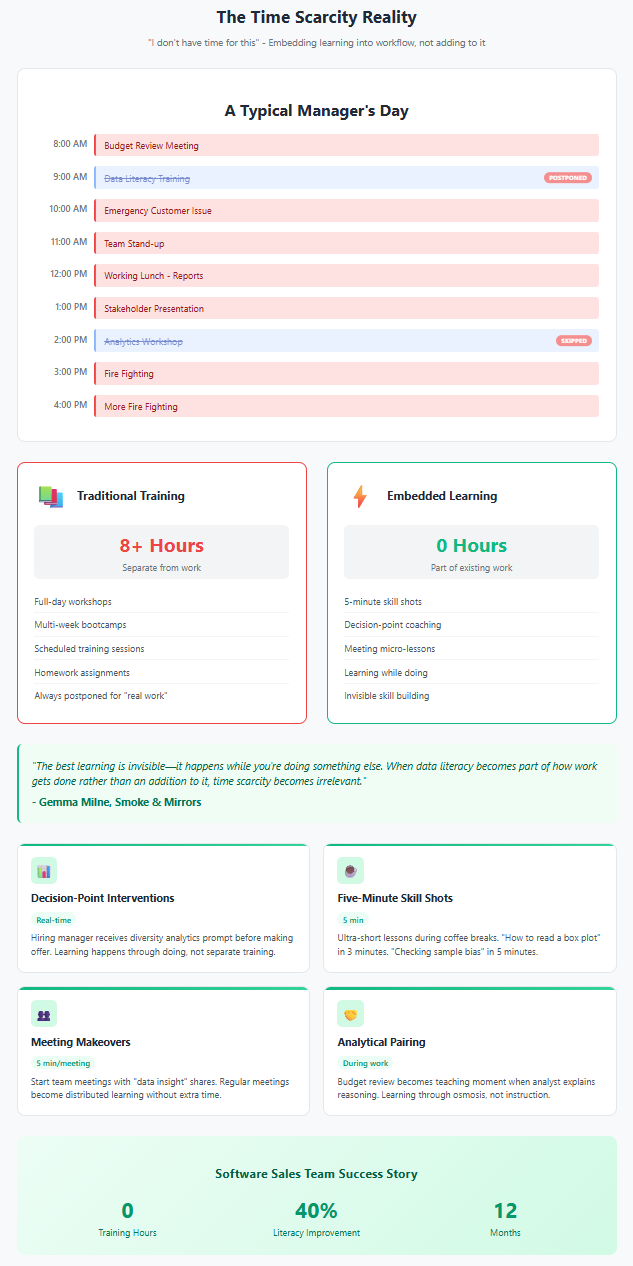
Obstacle 4: The Time Scarcity Reality - "I Don't Have Time for This"
The Pattern
The most common resistance to data literacy isn't philosophical—it's practical. People genuinely don't have time for extensive training programs. They're juggling multiple priorities, fighting daily fires, and struggling to keep up with existing responsibilities. Adding data literacy feels like one more obligation in an already overwhelming list.
This manifests as:
- Training sessions scheduled but repeatedly postponed
- Participants multitasking during learning sessions
- Reverting to old methods under time pressure
- Resentment toward initiatives perceived as "nice to have"
The Deep Structure
Time scarcity reflects real organizational challenges. Most companies operate with lean staffing, leaving little slack for capability development. The pressure for quarterly results creates what researchers call "capability trap"—being too busy fighting current fires to develop capabilities that would prevent future ones.
Moreover, traditional training approaches assume people can step away from work for extended periods—an increasingly unrealistic assumption in modern organizations. The eight-hour workshop or week-long boot camp might work in theory but fails in practice.
The Solution: Embedded Micro-Learning
The answer lies in what we might call "workflow-integrated learning"—building data literacy development into existing work processes rather than treating it as a separate activity requiring additional time.
Tactical Implementation:
1. Decision-Point Interventions: Identify regular decisions people make and embed analytical thinking prompts directly into these processes. A hiring manager might receive a prompt to review diversity analytics before making an offer. Learning happens through doing, not through separate training.
2. Five-Minute Skill Shots: Create libraries of ultra-short lessons targeting specific skills. "How to read a box plot" in three minutes. "Checking for sample bias" in five minutes. People can learn during coffee breaks rather than needing dedicated training time.
3. Meeting Makeovers: Transform existing meetings into learning opportunities. Start each team meeting with a five-minute "data insight" where someone shares an analytical finding. Regular meetings become distributed learning sessions without requiring additional time.
As Gemma Milne notes in Smoke & Mirrors, "The best learning is invisible—it happens while you're doing something else. When data literacy becomes part of how work gets done rather than an addition to it, time scarcity becomes irrelevant."
4. Analytical Pairing: During regular work, pair analytical novices with more experienced colleagues. A budget review becomes a teaching moment when an analyst explains their reasoning while building reports. Learning happens through osmosis rather than formal instruction.
5. Automated Coaching: Build gentle analytical coaching into existing tools. A dashboard might include hover-over explanations of statistical concepts. An Excel template might include prompts about data quality checks. The tools themselves become teachers.
Case Example: The Always-On Sales Force
A software company's sales team resisted all training initiatives, claiming they couldn't afford time away from selling. The solution: embed micro-learning into their CRM system. When viewing pipeline reports, pop-ups explained statistical concepts like conversion probability. Weekly sales calls included five-minute segments where reps shared data insights.
Most innovatively, they created "loss analysis" templates that guided analytical thinking during the existing post-mortem process. Sales reps learned statistical reasoning while analyzing why deals failed—something they were already motivated to understand. Within a year, data literacy scores improved 40% with zero dedicated training time.
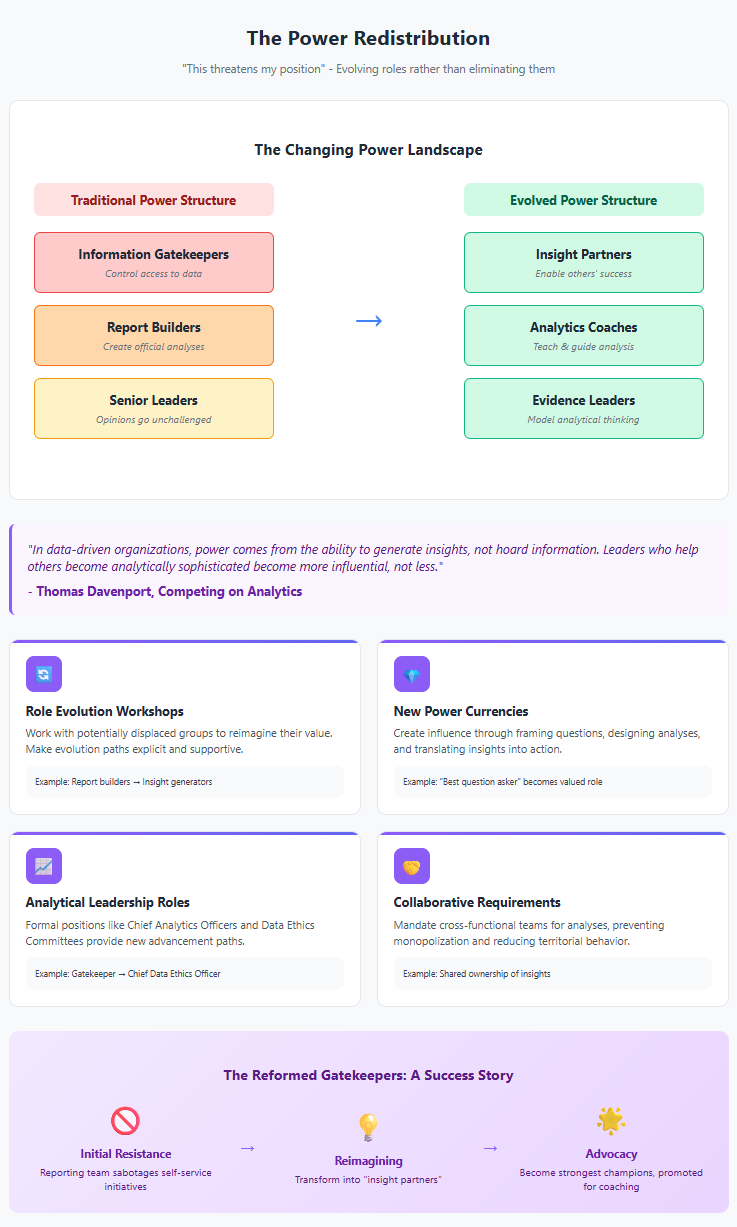
Obstacle 5: The Power Redistribution - "This Threatens My Position"
The Pattern
Data literacy can fundamentally alter organizational power dynamics. Middle managers who controlled information flow lose gatekeeping power when everyone can access dashboards. Senior leaders whose opinions went unchallenged face subordinates armed with contradictory data. Entire departments built around report generation face existential questions about their value.
This creates resistance that's rarely expressed directly:
- Information hoarding disguised as "data governance"
- Complexity theater that makes analysis seem harder than necessary
- Subtle discouragement of analytical initiatives in their areas
- Creating competing "official" analyses that muddy waters
The Deep Structure
Power redistribution touches on fundamental human needs for status and control. In many organizations, information asymmetry is a source of power. Those who can access, interpret, and distribute information hold influence. Democratizing these capabilities threatens established hierarchies.
This is compounded by legitimate concerns about job security. If everyone can pull their own reports, what happens to reporting teams? If junior analysts can challenge senior assumptions with data, how do leaders maintain authority? These aren't just ego issues—they're practical concerns about career sustainability.
The Solution: Power Evolution Strategies
Rather than pretending power dynamics don't exist, successful transformations explicitly address how roles and influence will evolve. This requires what we might call "power transition planning"—helping people find new sources of value and influence that align with a more data-literate organization.
Tactical Implementation:
1. Role Evolution Workshops: Work with potentially displaced groups to reimagine their roles. Report builders might become insight generators. Information gatekeepers might become analytical coaches. Make the evolution path explicit and supportive.
2. New Power Currencies: Create new forms of organizational influence aligned with data literacy. The ability to frame good questions, design meaningful analyses, or translate insights into action becomes more valuable than simply accessing data.
3. Analytical Leadership Roles: Create formal positions that recognize analytical leadership—Chief Analytics Officers, Insight Team Leaders, Data Ethics Committees. This provides advancement paths that reward analytical sophistication rather than information hoarding.
As Thomas Davenport argues in Competing on Analytics, "In data-driven organizations, power comes from the ability to generate insights, not hoard information. Leaders who help others become analytically sophisticated become more influential, not less."
4. Collaborative Analysis Requirements: Mandate that major analyses include cross-functional teams, preventing any single group from monopolizing analytical influence. Shared ownership reduces territorial behavior.
5. Transparency Protocols: Implement radical transparency around data access and analysis methods. When everyone can see who's accessing what data and how analyses are constructed, information hoarding becomes impossible.
Case Example: The Reformed Gatekeepers
A financial services firm's reporting team initially sabotaged self-service analytics initiatives, creating increasingly complex reports that "proved" business users needed their expertise. Leadership recognized the pattern and engaged the team in reimagining their role.
They transformed from "report builders" to "insight partners," teaching business users to conduct analyses while focusing their own efforts on complex, strategic questions. Their new performance metrics rewarded user enablement rather than report volume. Two years later, the former gatekeepers were the organization's strongest data literacy advocates, with several promoted to leadership positions based on their coaching effectiveness.
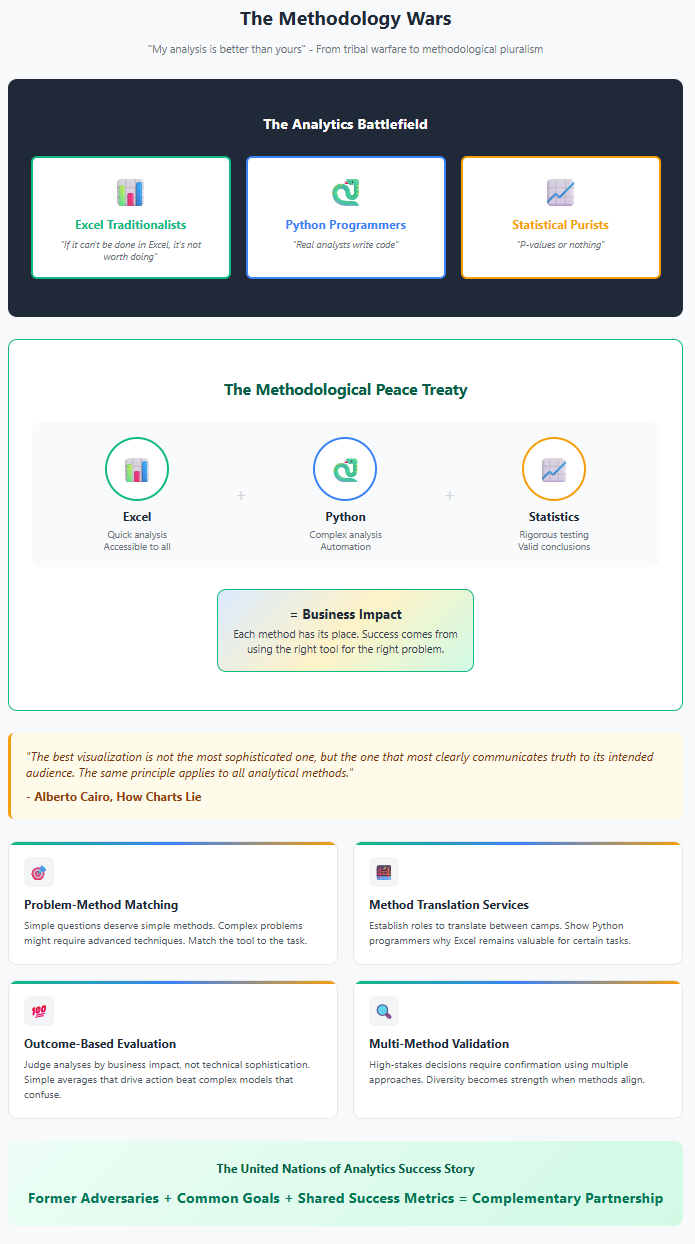
Obstacle 6: The Methodology Wars - "My Analysis Is Better Than Yours"
The Pattern
As organizations develop analytical capabilities, they often fragment into methodological tribes. The Excel traditionalists battle the Python programmers. The statistical purists clash with the machine learning enthusiasts. These methodology wars create paralysis as teams debate tools and techniques rather than solving problems.
Common symptoms include:
- Endless debates about the "right" way to analyze data
- Competing analyses using different methods reaching different conclusions
- Technical one-upmanship that alienates business users
- Analysis paralysis as teams seek methodological perfection
The Deep Structure
Methodology wars reflect what philosophers call "epistemic closure"—when communities become so invested in particular ways of knowing that they can't recognize the validity of alternatives. In data literacy contexts, this manifests as analytical fundamentalism—the belief that one's preferred methods are uniquely correct.
This is exacerbated by the rapid evolution of analytical techniques. People who invested heavily in learning specific methods feel threatened when newer approaches emerge. The statistical training someone received in graduate school might feel obsolete compared to modern machine learning, creating defensive responses.
The Solution: Methodological Pluralism
The answer isn't choosing winners in methodology wars but creating what we might call "analytical pragmatism"—focusing on problem-solving effectiveness rather than methodological purity. This requires cultural shifts that value outcomes over orthodoxy.
Tactical Implementation:
1. Problem-Method Matching Frameworks: Create clear guidelines about which methods suit which problems. Simple questions deserve simple methods. Complex problems might require advanced techniques. The framework legitimizes all approaches within appropriate contexts.
2. Method Translation Services: Establish roles focused on translating between methodological camps. Someone who can explain machine learning predictions in terms statistical traditionalists understand, or show Python programmers why Excel remains valuable for certain tasks.
3. Outcome-Based Evaluation: Judge analyses based on their business impact rather than technical sophistication. A simple average that drives action beats a complex model that confuses stakeholders. This shifts focus from methodological elegance to practical effectiveness.
As Alberto Cairo writes in How Charts Lie, "The best visualization is not the most sophisticated one, but the one that most clearly communicates truth to its intended audience. The same principle applies to all analytical methods."
4. Multi-Method Validation Requirements: For high-stakes decisions, require confirmation using multiple analytical approaches. If Excel pivots, SQL queries, and Python analyses reach similar conclusions, confidence increases. This turns methodological diversity from weakness to strength.
5. Regular Method Showcases: Create forums where different analytical approaches are demonstrated on the same problem. Seeing multiple valid paths to insight reduces fundamentalism and increases appreciation for methodological diversity.
Case Example: The United Nations of Analytics
A technology company's analytics team had split into warring factions: SQL traditionalists, R statisticians, and Python data scientists. Each group produced competing analyses that confused business stakeholders and delayed decisions.
The solution began with a "methods amnesty"—acknowledgment that all approaches had value. They created mixed-method teams for major projects, requiring each faction to contribute their perspective. They also established "translation rounds" where each group explained their approach to others.
Most importantly, they began measuring success by stakeholder satisfaction rather than technical metrics. When bonuses depended on business impact rather than methodological purity, cooperation replaced competition. The former adversaries became complementary partners, with the organization benefiting from their combined expertise.
The Meta-Solution: Building Anti-Fragile Data Literacy
Beyond specific obstacles lies a deeper insight: organizations need data literacy approaches that get stronger when challenged rather than breaking under resistance. This requires what Nassim Taleb calls "anti-fragility"—systems that improve when stressed rather than merely surviving.
Creating Evolutionary Pressure
Rather than viewing resistance as a problem to overcome, reframe it as evolutionary pressure that strengthens the program. Each obstacle faced and solved makes the organization more capable of handling future challenges. This requires:
1. Resistance Documentation Systems: Carefully catalog all forms of resistance encountered and solutions developed. This creates an organizational memory that accelerates future problem-solving.
2. Obstacle Prediction Protocols: Before launching initiatives in new areas, predict likely resistance patterns based on past experience. Proactive planning prevents reactive scrambling.
3. Solution Sharing Networks: Create mechanisms for different parts of the organization to share resistance-overcoming strategies. What worked in manufacturing might inspire solutions in marketing.
The Compound Effect of Tactical Solutions
Individual tactical solutions compound over time. The manager who overcomes expertise threat becomes an advocate who helps others. The team that conquers confidence gaps creates peer mentors. Each overcome obstacle reduces future resistance.
This compounding effect means that initial progress might feel slow, but acceleration increases over time. Organizations report that the second year of transformation is easier than the first, and the third easier still. Resistance-overcoming capability itself becomes a core competency.
Building Organizational Resilience
The ultimate goal isn't just overcoming current resistance but building organizational resilience that handles future challenges adaptively. This means creating:
- Cultural appreciation for analytical thinking that survives leadership changes
- Distributed expertise that doesn't depend on specific individuals
- Flexible approaches that adapt to new technologies and methods
- Learning systems that get better at learning over time
As Jordan Morrow emphasizes in Be Data Literate, "Data literacy isn't a destination but a journey. Organizations that build capability to handle resistance and obstacles don't just become data literate—they become learning organizations capable of continuous adaptation."
Conclusion: The Alchemy of Transformation
The obstacles to data literacy transformation are real, substantial, and predictable. But they're not insurmountable. Each resistance pattern has specific solutions that, when properly applied, transform opposition into opportunity.
The expertise threat becomes expertise enhancement. Confidence gaps become capability building. Tool fixation becomes pragmatic empowerment. Time scarcity becomes embedded learning. Power redistribution becomes role evolution. Methodology wars become analytical diversity.
Most importantly, overcoming these obstacles builds organizational muscles that extend beyond data literacy. The skills developed in handling resistance—empathy, creativity, strategic thinking, cultural sensitivity—enhance overall organizational capability.
The path forward requires neither naive optimism nor cynical resignation. It demands clear-eyed recognition of challenges coupled with systematic approaches to addressing them. When organizations commit to this path, they discover that resistance isn't the enemy of transformation—it's the raw material from which stronger capabilities are forged.
In the end, the organizations that successfully build data literacy don't do so by avoiding obstacles. They succeed by becoming excellent at transforming obstacles into stepping stones. This alchemy of transformation—turning resistance into capability—represents the deepest form of organizational learning.
The journey continues, but armed with these tactical solutions, organizations can face resistance with confidence rather than frustration. Each obstacle overcome makes the next one easier. Each solution discovered adds to the collective wisdom. Each transformation achieved lights the path for others.
Data literacy remains one of the most critical capabilities for modern organizations. The obstacles are real, but so are the solutions. The only question is whether organizations will commit to the journey of transformation, knowing that the path, while challenging, leads to capabilities that compound over time and create sustained competitive advantage.
This blog post is the fourth in our series exploring data literacy transformation. In our next and final installment, we'll look toward the future—examining emerging trends, technologies, and possibilities that will shape the next generation of data literacy initiatives.