Case Studies in Data Literacy: How Organizations Transform Analytical Culture in Practice
The Bottom Line Up Front: Real-world data literacy transformations reveal a consistent pattern—success comes not from perfect execution of theoretical frameworks, but from organizations that adapt principles to their unique contexts while maintaining unwavering commitment to cultural change. The most instructive lessons emerge from examining both triumphs and struggles of organizations at different stages of their data literacy journeys.
The Reality of Implementation: Beyond Theory Into Practice
After exploring the philosophical foundations and implementation frameworks of data literacy in previous posts, we now turn to the most challenging question: What actually happens when organizations attempt these transformations? The gap between elegant frameworks and messy organizational reality is where true learning occurs.
The case studies that follow aren't stories of flawless execution. They're accounts of organizations grappling with competing priorities, legacy cultures, technical debt, and human resistance—yet still managing to create meaningful change. Each reveals different aspects of what it takes to build genuine data literacy capabilities at scale.
What makes these cases particularly instructive is their diversity. They span different industries, organizational sizes, and starting points in data maturity. Yet despite these differences, common patterns emerge—patterns that suggest universal principles underlying successful data literacy transformation.
Case Study 1: Global Financial Services Firm - The Power of Executive Modeling
The Context: Fighting Legacy Decision-Making
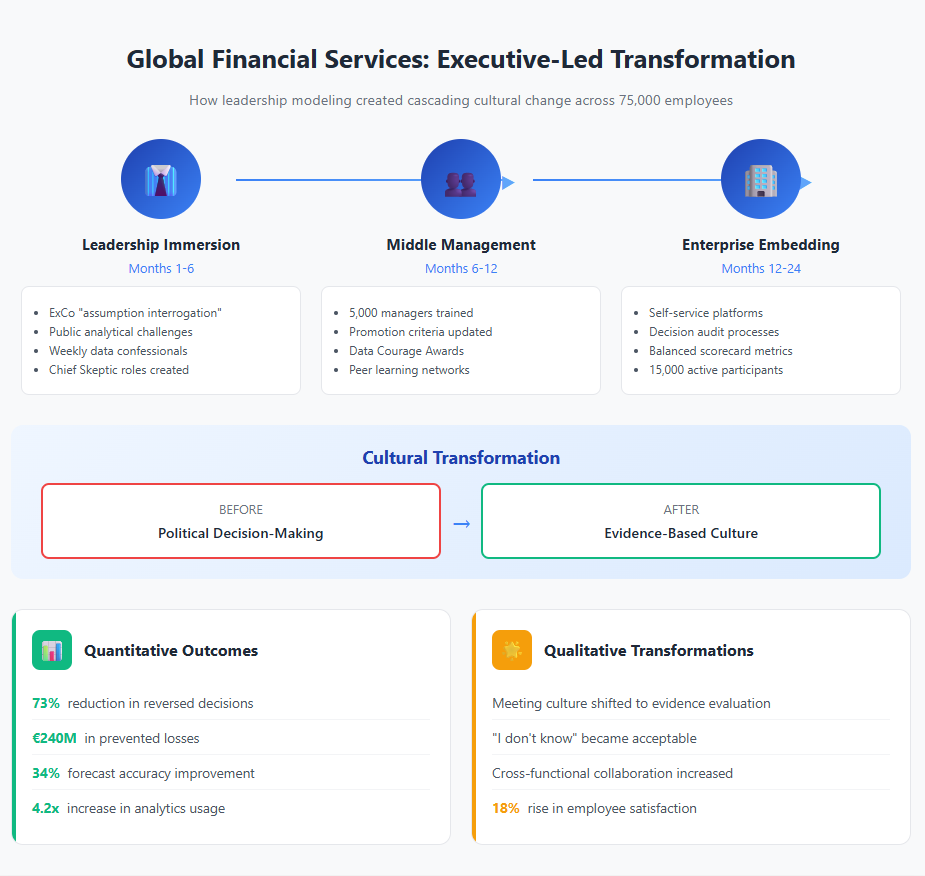
A multinational bank with 75,000 employees faced a classic challenge: despite massive investments in data infrastructure and analytics tools, decision-making remained largely political rather than empirical. Regional leaders cherry-picked metrics that supported predetermined strategies. Risk assessments relied more on relationships than rigorous analysis. The organization had data everywhere but data-driven thinking nowhere.
The trigger for change came from a near-catastrophic risk event that existing processes completely missed. Post-mortem analysis revealed that warning signals existed in the data but were ignored because they contradicted senior leadership assumptions. The board mandated a fundamental shift in how the organization used data for decision-making.
The Approach: Top-Down Cultural Revolution
Rather than starting with broad training initiatives, the transformation began with the executive committee. The CEO mandated that every ExCo meeting would begin with what they called "assumption interrogation"—a structured process where leaders had to explicitly state the assumptions underlying their proposals and present data that could potentially disconfirm those assumptions.
As Jordan Morrow writes in Be Data Literate, "The most important thing leaders can do is model the behavior they want to see. When leaders ask good questions about data, challenge assumptions, and admit uncertainty, it gives everyone else permission to do the same."
This wasn't theater. Executives who couldn't articulate their assumptions or who dismissed contradictory data faced public challenge from the CEO. One regional head was famously asked to redo an entire strategic presentation because he couldn't explain the sampling methodology behind his market research.
The psychological impact was profound. When senior leaders started asking questions like "What would we need to see in the data to prove this strategy wrong?" it sent shockwaves through the organization. Middle managers quickly learned that the path to advancement now required demonstrating analytical thinking, not just hitting numbers.
The Implementation: Cascading Epistemic Change
Following the executive modeling, the organization implemented a cascading approach:
Months 1-6: Leadership Immersion
- All senior leaders attended "Philosophical Foundations of Data-Driven Decisions" workshops
- Each leader identified 3-5 critical decisions in their domain for data-driven transformation
- Weekly "data confessionals" where leaders shared analytical mistakes and lessons learned
- Creation of a "Chief Skeptic" role in each major division to challenge analytical assumptions
Months 6-12: Middle Management Transformation
- Persona-based learning paths rolled out to 5,000 middle managers
- Promotion criteria explicitly updated to include analytical thinking capabilities
- "Data Courage Awards" recognized employees who used data to challenge conventional wisdom
- Peer learning networks established around specific analytical challenges
Months 12-24: Enterprise-Wide Embedding
- Self-service analytics platforms deployed with embedded epistemic guidance
- Decision audit processes implemented for all major choices
- Data literacy metrics incorporated into balanced scorecards
- Communities of practice scaled to include 15,000 active participants
The Results: Measurable Cultural Shift
After 24 months, the transformation showed remarkable results:
Quantitative Outcomes:
- 73% reduction in major decisions reversed within 90 days
- €240 million in prevented losses from improved risk identification
- 34% improvement in forecast accuracy across all business units
- 4.2x increase in self-service analytics platform usage
Qualitative Transformations:
- Meeting culture shifted from political maneuvering to evidence evaluation
- "I don't know" became an acceptable answer, leading to better problem identification
- Cross-functional collaboration increased as data became a common language
- Employee satisfaction scores increased 18% due to "more rational decision-making"
The Lessons: Leadership as Cultural Architecture
The bank's experience reveals several critical insights:
- Authentic executive commitment trumps perfect training programs. When senior leaders genuinely model analytical thinking, it creates more change than any training initiative.
As Valerie Logan and Prashanth Southekal emphasize in Data Governance: The Definitive Guide, "Culture eats strategy for breakfast, but leadership shapes culture. When executives consistently demonstrate data-driven decision-making, it becomes 'how we do things here' rather than an imposed requirement."
- Making analytical thinking visible accelerates adoption. The public nature of assumption interrogation and data confessionals created social pressure for empirical thinking.
- Structural changes reinforce cultural changes. Updating promotion criteria and decision processes embedded new behaviors into organizational DNA.
- Celebrating analytical courage matters more than punishing mistakes. The Data Courage Awards created heroes out of people who challenged powerful stakeholders with data.
Case Study 2: Regional Healthcare Network - Building from the Middle Out
The Context: Data Rich but Insight Poor
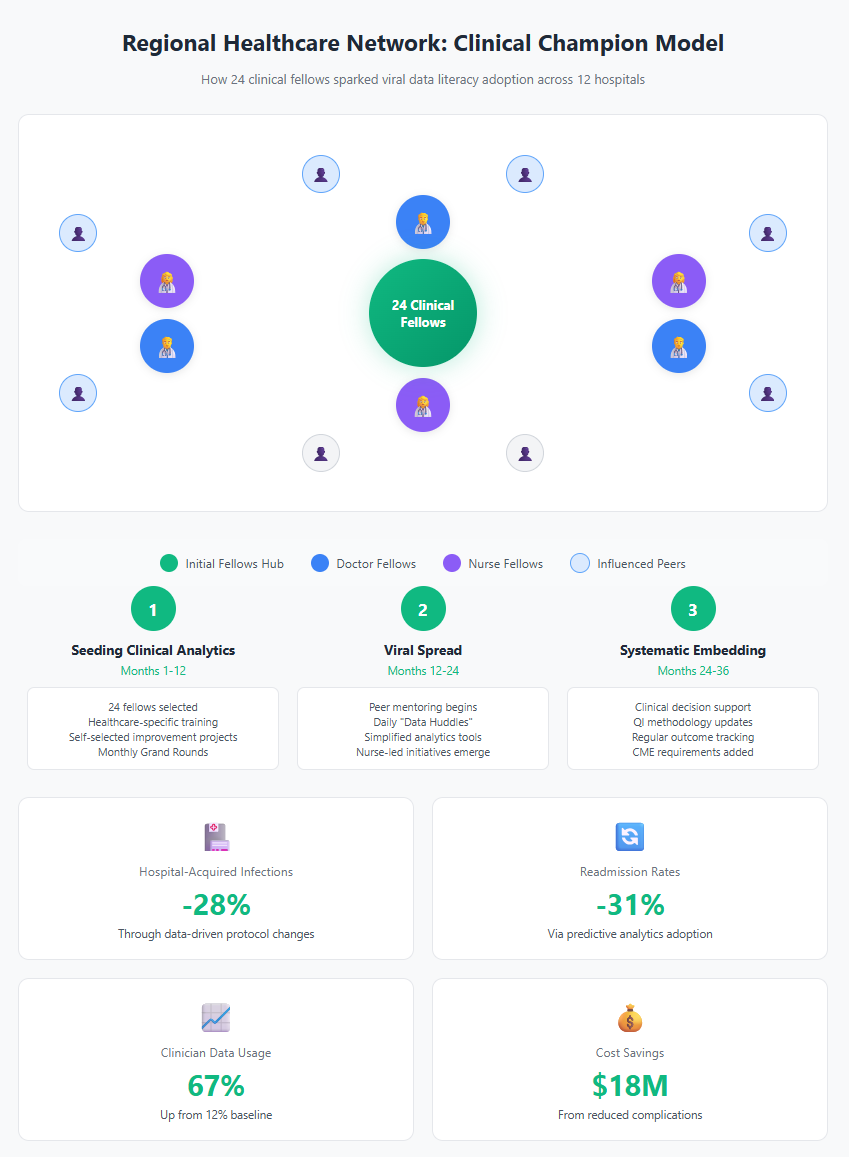
A healthcare network comprising 12 hospitals and 200 clinics faced a paradox: they collected vast amounts of patient data but struggled to use it for improving care outcomes. Clinicians viewed data systems as administrative burdens. Quality improvement initiatives relied on anecdotes rather than systematic analysis. Despite having sophisticated health information systems, the organization ranked in the bottom quartile for key quality metrics.
Unlike the bank, this organization couldn't rely on top-down mandates. The highly autonomous nature of medical professionals meant that change had to emerge from clinical leaders who commanded peer respect.
The Approach: Clinical Champion Networks
The transformation began by identifying "data-curious" clinicians—doctors and nurses who already showed interest in using data to improve patient care. Rather than focusing on technical training, the program started with a fundamental question: "How do we know if we're actually helping patients?"
This approach aligns with Kevin Hanegan's observation in Turning Data Into Wisdom: "Data literacy isn't about making everyone a data scientist. It's about helping people in their specific roles use data to make better decisions. The context matters as much as the competency."
The organization created what they called "Clinical Data Fellowships"—six-month programs where practicing clinicians spent 20% of their time learning to investigate care quality questions using data. Crucially, fellows chose their own improvement projects based on frustrations they experienced in daily practice.
The Implementation: Peer-Led Transformation
The fellowship model created natural evangelists who could speak the language of clinical care while demonstrating analytical thinking:
Phase 1: Seeding Clinical Analytics (Months 1-12)
- 24 clinical fellows selected across specialties and facilities
- Fellows learned basic statistical reasoning through healthcare-specific examples
- Each fellow completed an improvement project using data to challenge conventional practices
- Monthly "Grand Rounds" style presentations where fellows shared findings with peers
Phase 2: Viral Spread (Months 12-24)
- Fellows became mentors for colleagues interested in similar projects
- "Data Huddles" integrated into daily clinical workflows
- Simplified analytics tools designed specifically for clinical questions
- Nurse-led data literacy initiatives emerged organically
Phase 3: Systematic Embedding (Months 24-36)
- Clinical decision support systems redesigned to promote empirical thinking
- Quality improvement methodologies updated to require data analysis
- Patient outcome tracking became part of regular clinical discussions
- Data literacy included in continuing medical education requirements
The Results: Quality Through Curiosity
The healthcare network's approach yielded impressive improvements:
Clinical Outcomes:
- 28% reduction in hospital-acquired infections through data-driven protocol changes
- 31% decrease in readmission rates via predictive analytics adoption
- 19% improvement in patient satisfaction scores
- $18 million in cost savings from reduced complications
As Ben Jones writes in Avoiding Data Pitfalls, "The best data literacy programs don't just teach people to analyze data—they teach them to ask better questions. In healthcare, better questions literally save lives."
Cultural Transformation:
- 67% of clinicians regularly used data in patient care decisions (up from 12%)
- Peer-reviewed publications by network clinicians increased 300%
- Inter-departmental collaboration on quality improvements increased 5x
- Clinical staff turnover decreased 22% due to increased engagement
The Lessons: Respect Professional Autonomy
The healthcare network's experience offers different insights than the bank:
- Start with intrinsic motivation, not external mandates. Clinicians engaged because data helped them solve problems they cared about, not because leadership required it.
- Peer credibility accelerates adoption more than hierarchical pressure. When respected clinicians demonstrated data use, colleagues paid attention.
- Context-specific applications matter more than general principles. Teaching statistical concepts through clinical examples made abstract ideas concrete.
- Organic growth creates more sustainable change than structured rollouts. The viral spread model created ownership at every level.
Case Study 3: Mid-Size Manufacturing Company - The Pragmatic Approach
The Context: Competing with Giants
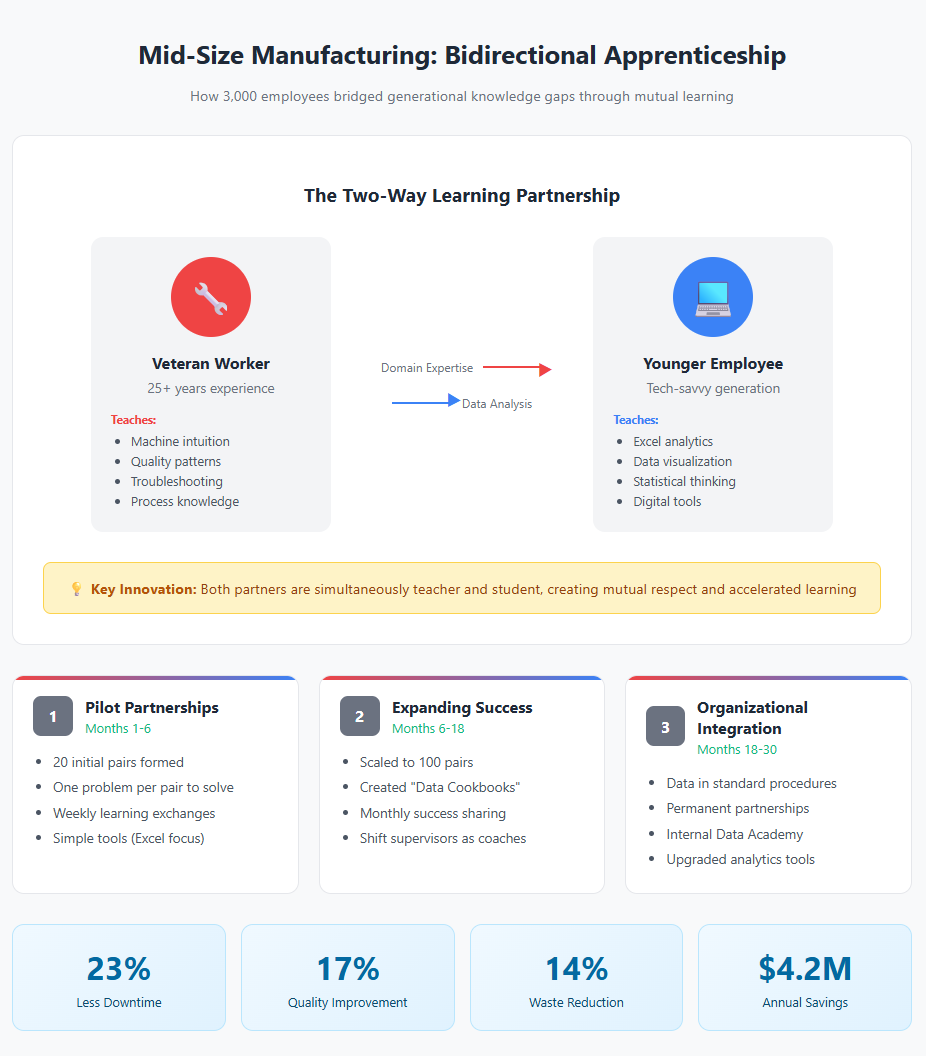
A family-owned manufacturing company with 3,000 employees faced existential pressure. Larger competitors used advanced analytics for everything from supply chain optimization to predictive maintenance. The company's traditional strength—experienced workers who "knew" their machines—was becoming a liability as younger workers lacked this intuitive knowledge.
The organization had limited resources for transformation. No army of consultants. No massive training budgets. No sophisticated learning management systems. Just a recognition that building data literacy capabilities was essential for survival.
The Approach: Data Literacy as Apprenticeship
Drawing inspiration from their traditional apprenticeship model for technical skills, the company created a "Data Apprenticeship" program. Experienced workers partnered with younger, more technically savvy employees to combine domain expertise with analytical capabilities.
The twist: apprenticeship ran both directions. Veteran workers taught domain knowledge while younger workers taught data analysis. This mutual learning model respected both forms of expertise while building bridges between generations.
As Jane Crofts notes in Data Literacy in Practice, "The most effective data literacy programs recognize that everyone brings valuable knowledge to the table. It's not about replacing intuition with data, but about combining human insight with analytical rigor to make better decisions."
The Implementation: Practical Learning Partnerships
Stage 1: Pilot Partnerships (Months 1-6)
- 20 apprenticeship pairs formed across production, quality, and maintenance
- Each pair identified one operational problem to solve using data
- Weekly "learning exchanges" where pairs taught each other
- Simple tools (Excel, basic statistical software) rather than complex platforms
Stage 2: Expanding Success (Months 6-18)
- Successful pairs presented solutions at monthly all-hands meetings
- Apprenticeship model expanded to 100 pairs
- Creation of "Data Cookbooks"—step-by-step guides for common analyses
- Shift supervisors trained as "Data Coaches" to support pairs
Stage 3: Organizational Integration (Months 18-30)
- Data analysis integrated into standard operating procedures
- Apprenticeship pairs evolved into permanent analytical partnerships
- Investment in intermediate analytics tools based on proven needs
- Creation of internal "Data Academy" run by successful apprentices
The Results: Practical Transformation
Despite limited resources, the manufacturing company achieved significant improvements:
Operational Impact:
- 23% reduction in unplanned downtime through predictive maintenance
- 17% improvement in first-pass quality rates
- 14% decrease in raw material waste
- $4.2 million in annual cost savings
Organizational Development:
- 78% of production workers actively used data in daily decisions
- Knowledge transfer between generations accelerated dramatically
- Employee engagement scores increased 26%
- Company won three new major contracts based on analytical capabilities
The Lessons: Resource Constraints Drive Innovation
The manufacturing company's experience challenges common assumptions:
- Limited resources can catalyze creative solutions. The apprenticeship model cost little but created more engagement than expensive training programs.
- Bidirectional learning respects all forms of expertise. Veterans felt valued for their knowledge while learning new skills.
As Gemma Milne notes in Smoke & Mirrors: How Hype Obscures the Future, "The most innovative solutions often emerge from constraints. When you can't throw money at a problem, you're forced to think more deeply about what actually drives change."
- Starting simple builds confidence for complexity. Excel mastery preceded advanced analytics adoption.
- Practical problems drive theoretical learning. Workers learned statistics because they needed it, not because someone said they should.
Case Study 4: Government Agency - The Compliance Catalyst
The Context: Mandate Meets Resistance
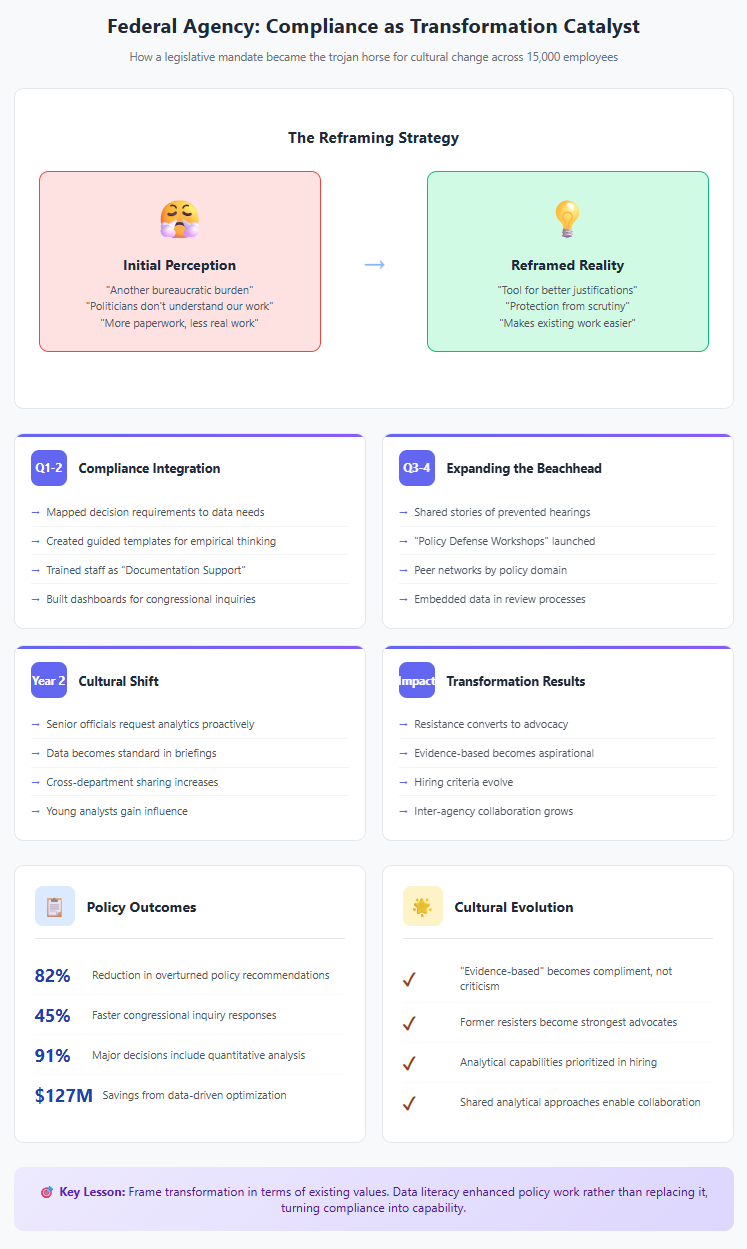
A federal agency with 15,000 employees received a legislative mandate to become "data-driven" in all major decisions. This created a unique challenge: building data literacy capabilities among employees who viewed the mandate as another bureaucratic burden imposed by politicians who didn't understand their work.
The agency's culture prioritized policy expertise and stakeholder relationships. Many senior officials built careers on navigating political landscapes, not analyzing datasets. The mandate threatened established power structures and ways of working.
The Approach: Compliance as Trojan Horse
Rather than fighting resistance directly, the transformation team used compliance requirements as a vehicle for cultural change. They positioned data literacy not as a new burden but as a way to make existing compliance requirements easier to meet.
The key insight: every policy decision already required justification. Data literacy simply meant providing better justifications that would withstand scrutiny. This reframing transformed data analysis from an additional task to a tool for making existing work easier.
This strategy exemplifies what Rahul Bhargava and Catherine D'Ignazio describe in Data Culture Project: "Successful data literacy initiatives meet people where they are, not where we think they should be. They connect data skills to problems people already care about solving."
The Implementation: Stealth Transformation
Quarter 1-2: Compliance Integration
- Mapped existing decision documentation requirements to data analysis needs
- Created templates that guided empirical thinking without calling it that
- Trained administrative staff as "Documentation Support Specialists" (actually data literacy coaches)
- Built simple dashboards that answered common congressional inquiry questions
Quarter 3-4: Expanding the Beachhead
- Success stories shared of how data analysis prevented embarrassing congressional hearings
- "Policy Defense Workshops" taught data skills as tools for protecting programs
- Created peer support networks around specific policy domains
- Embedded data requirements into existing review processes
Year 2: Cultural Shift
- Senior officials began requesting analytical support proactively
- Data analysis became standard in policy briefings
- Cross-department data sharing increased as silos recognized mutual benefit
- Young analysts gained influence by providing valuable empirical insights
The Results: Reluctant Revolution
The agency's transformation succeeded despite initial resistance:
Policy Outcomes:
- 82% reduction in policy recommendations overturned due to weak evidence
- 45% faster response time to congressional inquiries
- 91% of major decisions now included quantitative impact analysis
- $127 million in program savings from data-driven optimization
This transformation illustrates what Carl Anderson describes in Creating a Data-Driven Organization: "Resistance to data literacy often masks fear of exposure. When you can show people that data makes their work more defensible rather than more vulnerable, resistance transforms into enthusiasm."
Cultural Evolution:
- "Evidence-based" became a compliment rather than criticism
- Senior officials who initially resisted became strongest advocates
- Hiring criteria shifted to prioritize analytical capabilities
- Inter-agency collaboration increased through shared analytical approaches
The Lessons: Resistance as Design Constraint
The government agency's experience provides unique insights:
- Frame transformation in terms of existing values. Positioning data literacy as enhancing policy work rather than replacing it reduced resistance.
- Use compliance requirements as behavioral architecture. Mandates create action even without belief change.
- Let success convert skeptics. Early wins from reluctant participants became powerful testimonials.
- Embedded change sustains better than imposed change. Integration into existing processes ensured continuation beyond the initial mandate.
Cross-Case Analysis: Universal Patterns in Particular Contexts
Despite their different contexts, these cases reveal consistent patterns that suggest fundamental principles of successful data literacy transformation:
Pattern 1: Cultural Authenticity Beats Technical Sophistication
Every successful transformation honored the existing organizational culture while evolving it. The bank leveraged its hierarchical structure. The healthcare network respected clinical autonomy. The manufacturer built on apprenticeship traditions. The government agency used compliance culture.
Organizations that try to impose Silicon Valley-style data cultures on different contexts consistently fail. Successful transformation requires what anthropologists call "cultural scaffolding"—building new capabilities on existing cultural foundations rather than trying to replace them wholesale.
Pattern 2: Motivation Architecture Matters More Than Curriculum Design
The most sophisticated training programs failed when they didn't align with what employees actually cared about. Successful programs connected data literacy to intrinsic motivations:
- Bank executives wanted to avoid career-ending mistakes
- Clinicians wanted to help patients more effectively
- Manufacturing workers wanted to preserve their jobs and dignity
- Government officials wanted to defend their programs
This suggests that before designing any data literacy curriculum, organizations must deeply understand what their employees value and fear. The curriculum should then position data literacy as a tool for achieving valued outcomes and avoiding feared ones.
Pattern 3: Social Learning Trumps Individual Training
Traditional training models assume individual skill acquisition that then aggregates to organizational capability. But these cases show that data literacy spreads more like a social contagion than individual infection.
The bank's public assumption interrogation created social pressure. The healthcare network's grand rounds built peer influence. The manufacturer's apprenticeships fostered mutual obligation. The government agency's support networks provided social reinforcement.
This social dimension means that successful programs must design for network effects, not just individual learning. Who teaches matters more than what is taught. How learning is shared matters more than how it's acquired.
Pattern 4: Time Horizons Shape Transformation Strategies
Each organization's transformation timeline reflected its underlying rhythms:
- The bank moved quickly due to quarterly earnings pressure but took two years for cultural embedding
- The healthcare network moved slowly due to clinical validation requirements but achieved deeper change
- The manufacturer balanced urgency with pragmatism through phased expansion
- The government agency used compliance deadlines to force pace while allowing cultural evolution
Organizations must align transformation timelines with their natural cadences rather than imposing arbitrary deadlines. Pushing too fast creates superficial compliance. Moving too slowly loses momentum. The art lies in finding sustainable pace.
Pattern 5: Measurement Philosophy Determines Outcomes
How organizations measured success shaped what they achieved:
- The bank focused on decision quality metrics, improving strategic outcomes
- The healthcare network prioritized patient outcomes, enhancing care quality
- The manufacturer tracked operational efficiency, boosting competitiveness
- The government agency measured policy defensibility, increasing influence
This suggests that measurement isn't neutral assessment but active creation. Organizations get what they measure, so measurement frameworks must embody desired end states rather than just tracking activity metrics.
The Failure Patterns: Learning from What Doesn't Work
Equally instructive are the common failure patterns observed across multiple organizations:
Failure Pattern 1: The "Build It and They Will Come" Fallacy
Several organizations invested heavily in self-service analytics platforms assuming that access would drive adoption. One technology company spent $10 million on licenses and infrastructure, achieving only 8% active usage after 18 months.
The lesson: Tools without cultural readiness create expensive shelfware. Platform deployment should follow demonstrated demand rather than trying to create it.
Failure Pattern 2: The "One Size Fits All" Trap
A retail chain tried to implement identical data literacy training across corporate headquarters, regional offices, and store locations. The program failed spectacularly as store managers found corporate analytics examples irrelevant to their daily challenges.
The lesson: Context specificity matters more than content consistency. Effective programs adapt to local needs while maintaining core principles.
Failure Pattern 3: The "Technical Skills First" Mistake
Multiple organizations started with advanced analytics training, teaching regression analysis and machine learning to employees who hadn't yet grasped basic concepts like sampling bias or correlation versus causation.
The lesson: Epistemic foundations must precede technical skills. People need to understand what questions data can answer before learning specific analytical techniques.
Failure Pattern 4: The "Lone Wolf" Syndrome
Some organizations appointed a "Chief Data Officer" or "Head of Data Literacy" and expected them to drive transformation single-handedly. These leaders, regardless of competence, couldn't overcome organizational inertia alone.
The lesson: Transformation requires distributed leadership. Single points of accountability become single points of failure.
Synthesis: A Practical Theory of Data Literacy Transformation
These cases collectively suggest a practical theory of how organizations successfully build data literacy capabilities:
First, transformation must be culturally authentic. Rather than imposing foreign frameworks, successful programs translate data literacy concepts into existing cultural languages and values.
Second, motivation architecture precedes curriculum design. Understanding what employees care about and connecting data literacy to those concerns drives engagement more than sophisticated content.
Third, social dynamics dominate individual development. Programs must design for peer influence, social learning, and network effects rather than focusing solely on individual skill acquisition.
Fourth, sustainable pace beats forced marches. Aligning transformation timelines with organizational rhythms creates lasting change while arbitrary deadlines produce superficial compliance.
Fifth, measurement philosophy shapes outcomes. What organizations choose to measure and how they measure it actively creates the future rather than passively assessing progress.
Sixth, distributed leadership enables scaled transformation. Single leaders can catalyze but cannot sustain change. Success requires champions throughout the organization.
Finally, epistemic foundations enable technical skills. Teaching people how to think about data must precede teaching them how to work with data.
The Path Forward: Lessons for Your Journey
For organizations beginning their data literacy journeys, these cases offer practical guidance:
Start with Cultural Assessment
Before designing any program, deeply understand your organizational culture. What do people value? What do they fear? How do decisions really get made? What kinds of evidence carry weight? This anthropological work provides the foundation for culturally authentic transformation.
Design for Intrinsic Motivation
Connect data literacy to what employees already care about. Don't try to make them care about data in abstract. Instead, show how data literacy helps them achieve existing goals more effectively. This requires different approaches for different roles and levels.
Create Social Learning Systems
Move beyond individual training to design social learning experiences. Public forums for sharing analytical insights. Peer teaching opportunities. Communities of practice around specific challenges. The goal is creating environments where data literacy spreads naturally through social networks.
Embrace Pragmatic Timelines
Resist pressure for overnight transformation while maintaining momentum. Set expectations for 18-36 month journeys. Create early wins to maintain support while building toward deeper cultural change. Align milestones with organizational rhythms rather than imposing arbitrary deadlines.
Measure What Matters
Design measurement frameworks that capture both capability development and outcome achievement. Track leading indicators (like quality of analytical questions asked) not just lagging indicators (like training completion rates). Let measurement philosophy embody desired end states.
Build Distributed Leadership
Identify and develop champions throughout the organization. Create formal and informal leadership roles around data literacy. Ensure every major department or division has someone who can translate enterprise goals into local action. Distributed leadership creates resilience and reach.
Foundation Before Features
Invest in epistemic foundations before technical training. Help people understand concepts like uncertainty, causation, and evidence quality before teaching specific analytical techniques. This foundational work pays dividends as people encounter new analytical challenges.
Conclusion: The Reality of Transformation
These cases reveal a fundamental truth about data literacy transformation: success comes not from perfect execution of theoretical frameworks but from thoughtful adaptation to organizational realities. Each organization found its own path while following universal principles.
The most encouraging insight is that transformation is possible across radically different contexts. Banks can become empirically rigorous. Healthcare networks can embrace systematic analysis. Manufacturing companies can combine wisdom with data. Government agencies can transform compliance into capability.
But transformation requires more than good intentions and training budgets. It demands deep understanding of organizational culture, thoughtful design of motivation systems, careful attention to social dynamics, and sustained commitment through inevitable challenges.
The organizations profiled here didn't achieve perfection. They still struggle with data quality, analytical mistakes, and pockets of resistance. But they've fundamentally changed how they approach decisions and problems. They've built cultures where empirical thinking thrives alongside domain expertise.
Their journeys suggest that data literacy transformation is less like installing new software and more like learning a new language—it takes time, practice, and patience, but eventually becomes natural. The goal isn't creating organizations of data scientists but fostering environments where everyone can think more clearly about evidence and uncertainty.
As you embark on or continue your own data literacy journey, remember that sustainable transformation honors what is while building toward what could be. The path forward requires both philosophical sophistication about the nature of knowledge and practical wisdom about organizational change.
The stakes remain high. In an increasingly complex and data-rich world, organizations that can't build collective analytical capabilities face existential risks. But as these cases demonstrate, transformation is possible for those willing to commit to the journey.
This blog post is the third in our series exploring data literacy transformation. Next, we'll examine specific techniques for overcoming common obstacles and resistance patterns that emerge during implementation.